
Sector rotation
Sector Rotation: How to Spot Where the Money Is Moving
Money keeps moving from one sector to another, like from IT to banks and autos. Here's how to spot it step by step on the Groups page.
On this page
- What is sector rotation?
- How to check sector rotation on Scan the Charts
- The 3 numbers that show sector rotation
- Step 1: Find the groups leading the market
- Step 2: Find where money is coming in
- Step 3: Find where money is leaving
- Step 4: Go from a group to its stocks
- Themes: rotation across sectors
- A one-minute rotation routine
- Common mistakes
- Frequently asked questions
What is sector rotation?
Sector rotation is the way money moves from one group of stocks to another as market leadership changes. When big money flows into a group, most of its stocks rise together and the strongest names lead. When that money moves on, the same stocks start to struggle, even if the companies themselves are doing well.
This matters for swing traders because a stock rarely moves alone. Breakouts in a group that buyers already favour tend to follow through better than breakouts in a group they are leaving.
- Rank shows which groups have been strongest over the last one to six months.
- The weekly move, the small number beside the rank, shows how many places a group climbed or fell in the past week. This is where rotation shows up.
- Median return and 20D H/L tell you whether a move is broad or driven by a few stocks.
Prefer to watch? I explain sector rotation in this video.
How to check sector rotation on Scan the Charts
The Groups page ranks every sector, industry and theme on one screen. Opening it takes a few steps:
- Open Scan the Charts and click Groups (the stacked layers icon) in the left sidebar.
- Choose Sector, Industry or Theme at the top.
- Pick a timeframe: 1D, 1W, 1M, 3M, 1Y or YTD.
- Click any group to see the industries or stocks inside it.
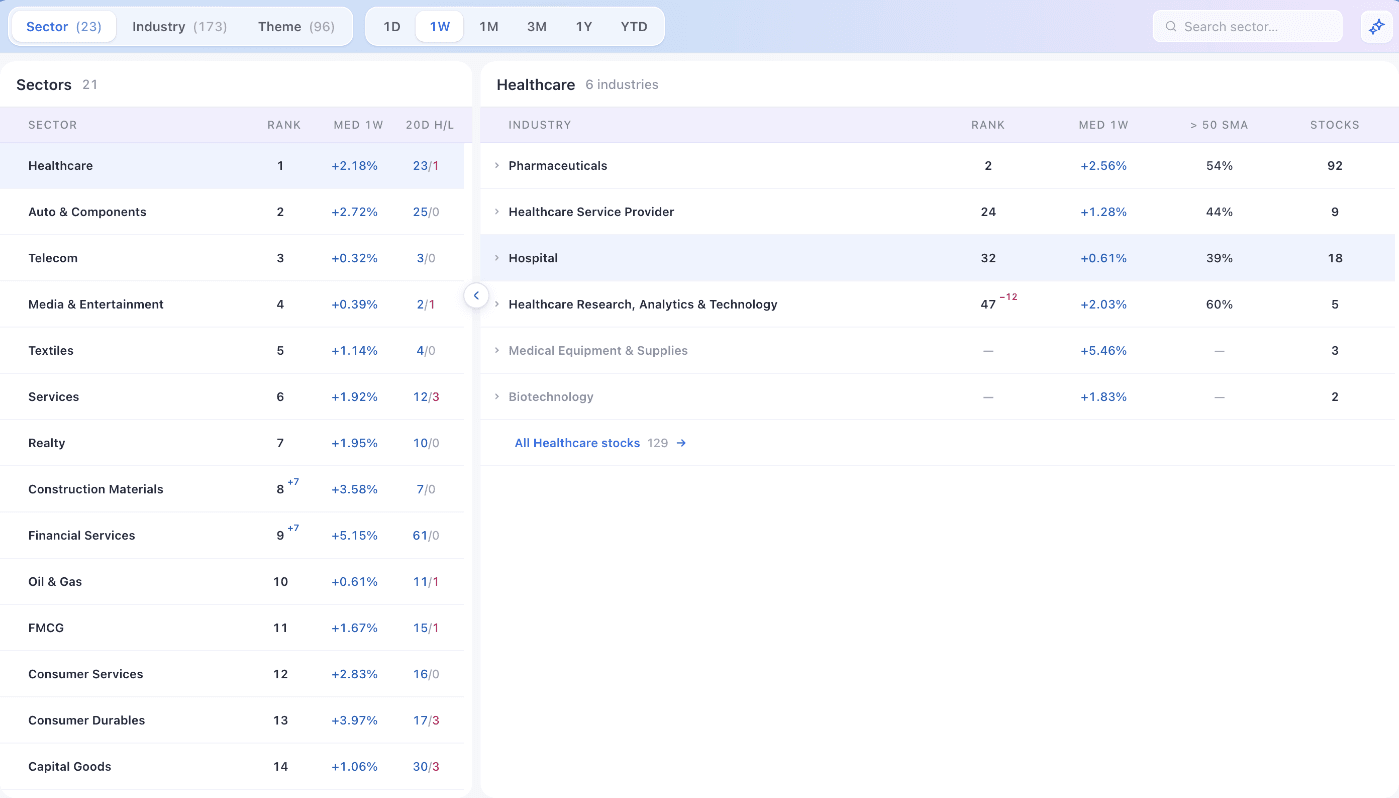
There are 23 sectors, 173 industries and 96 themes. Groups with very few stocks are hidden by default so they don't crowd the rankings. In the Industry and Theme views, tick Show small groups to include them.
Sectors give you the big picture. Industries and themes are narrower and often show rotation earlier, because one industry can start moving long before its whole sector does.
The 3 numbers that show sector rotation
Each row on the Groups page carries a few numbers. Together they tell you where a group sits in the cycle and which way it is heading.
1. Rank and the weekly move
Rank combines the group's trend over the last one to six months, its breadth (how many of its stocks are taking part) and the strength of its leading stocks. Rank 1 is the strongest. Rank stays the same whichever timeframe you pick.
The small number beside the rank is the weekly move: how many places the group climbed or fell in the past week, blue for up and pink for down. In the normal view it appears only for moves of more than 5 places, so it flags real shifts in leadership.

Rank tells you where a group stands. The weekly move tells you which way it is heading. Rotation shows up in the weekly move first.
2. Median return: how the typical stock is doing
Median return (MED) is the return of the middle stock in the group over the timeframe you choose. Half the stocks did better and half did worse.
Unlike an average, the median can't be pulled up by one stock that doubled, so it shows how the typical stock in the group is doing. The timeframe buttons change only this column. In our example, the typical Financial Services stock rose 5.15% in a week, against 0.32% for Telecom, even though Telecom was ranked higher.
3. 20D H/L: what is happening right now
20D H/L counts how many stocks in the group are at a 20-day high (the blue number) and how many are at a 20-day low (the pink number).
This is the fastest of the numbers. More highs than lows means fresh buying across the group. In our example, Financial Services had 61 stocks at 20-day highs and none at lows, so its climb was broad. Lows piling up in a high-ranked group are an early warning.
Step 1: Find the groups leading the market
Start with the normal rank order. The top rows are the groups that have been strongest for weeks or months.
- Choose Sector or Industry.
- Keep the normal order, with rank 1 at the top.
- Note the top five to ten groups.
- Check 20D H/L to see whether they are still making new highs.
In our example, the top five in the Sector view were Healthcare, Auto & Components, Telecom, Media & Entertainment and Textiles. The Industry view is more specific: Jewellery & Watches was ranked first, followed by Pharmaceuticals, Other Textile Products and Stockbroking & Allied.
The rows to watch are the ones with a blue weekly move. Here, Public Sector Banks and Private Sector Banks had both just entered the top six.
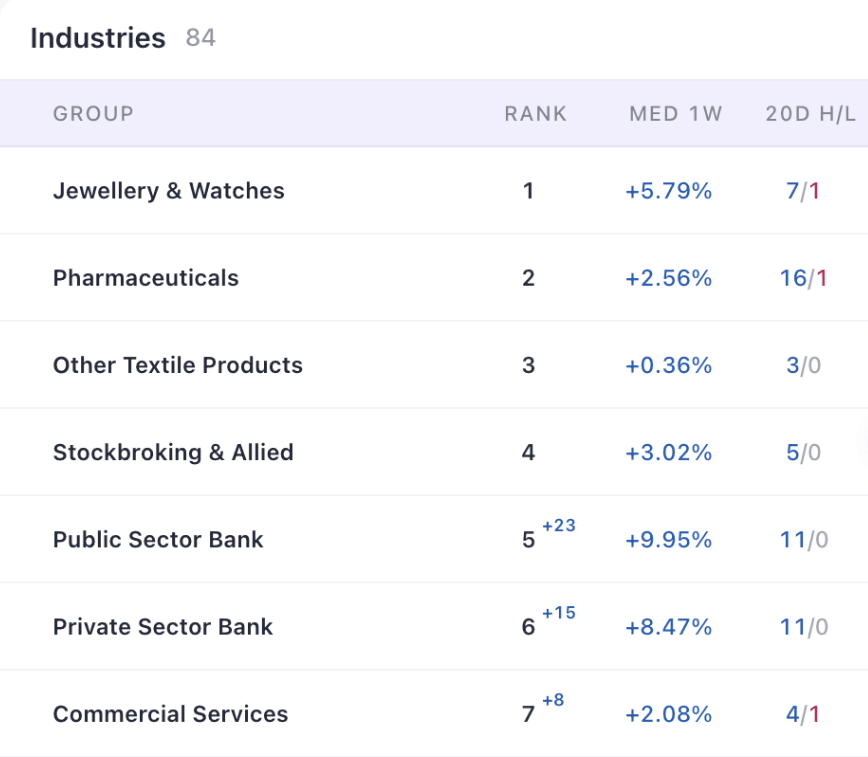
A group that is already near the top and still climbing is the strongest reading on this page. It is leading and getting stronger at the same time.
Step 2: Find where money is coming in
To see rotation directly, sort by the weekly move.
- Click the Rank column header twice. The list now shows the biggest climbers first, and every move is shown, not only moves of more than 5 places.
- Read the blue numbers from the top. These are the groups buyers are moving into.
- Check where each climber landed. A jump that ends near the top matters more than one that is still deep in the list.
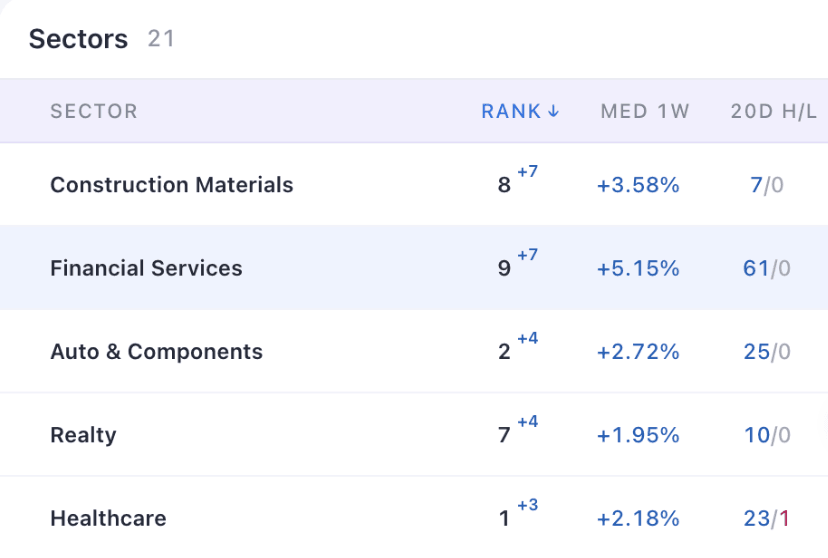
The Industry view shows the same move in more detail:
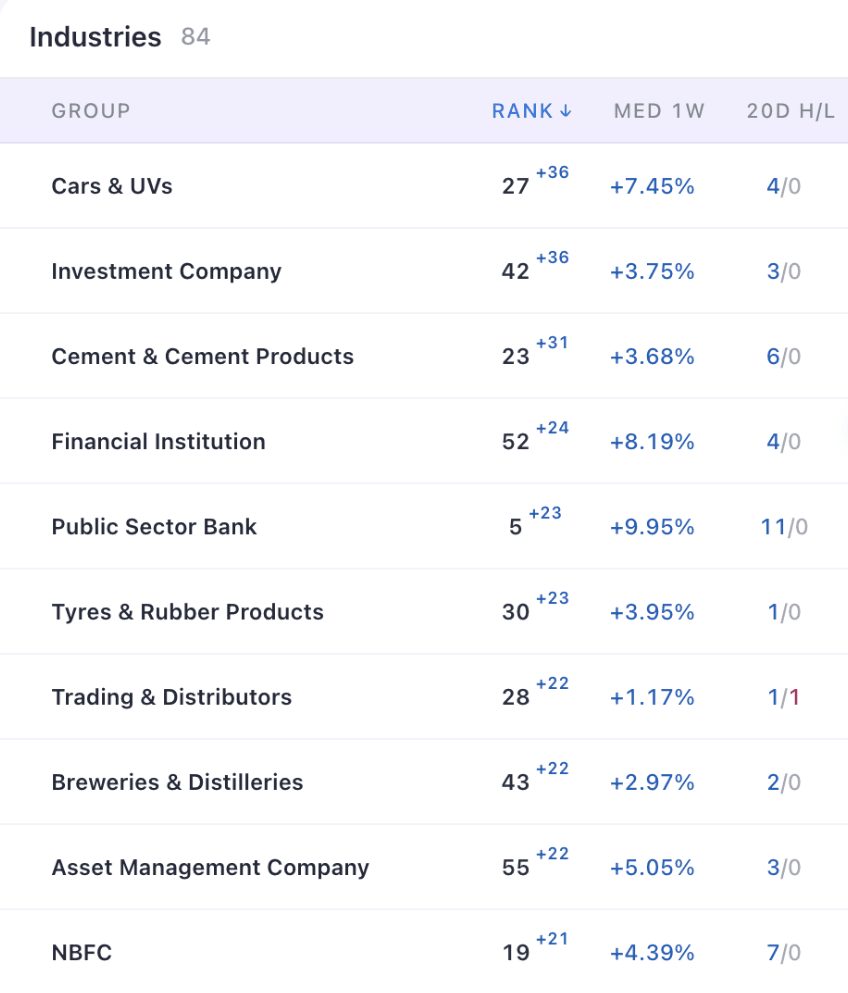
Look at where each climber landed. Investment Company jumped 36 places, but it was still ranked 42nd. It was improving, with a long way to go before it could lead. Public Sector Bank jumped 23 places and landed at rank 5, so it had already moved from improving into leading. Both climbed, and only one was a leader.
Notice how many of the climbers in this example were financial: Investment Company, Financial Institution, Public Sector Bank, Asset Management Company and NBFC. When several related industries climb together, the rotation is real.
Step 3: Find where money is leaving
Click the Rank header once more to sort by biggest fallers. These are the groups buyers are leaving.
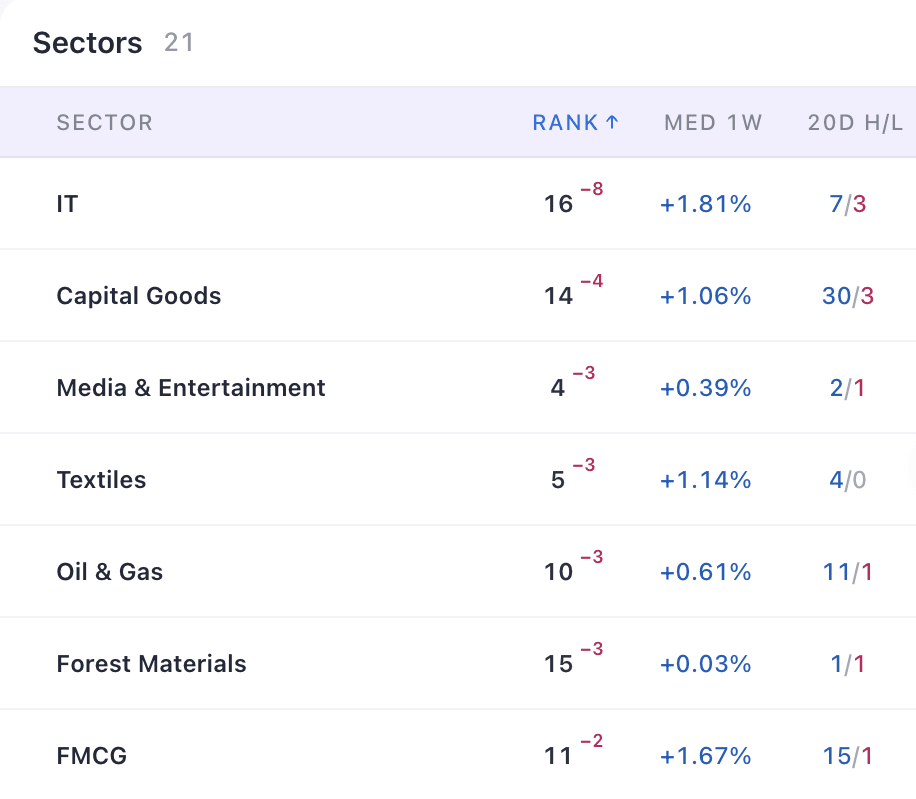
A fall in rank does not always mean a fall in price. Rank compares groups with each other. When money rushes into banks and autos, groups that rise more slowly slip down the list, and that is what happened to IT in this example.
The Industry view shows how broad the move out of IT was:
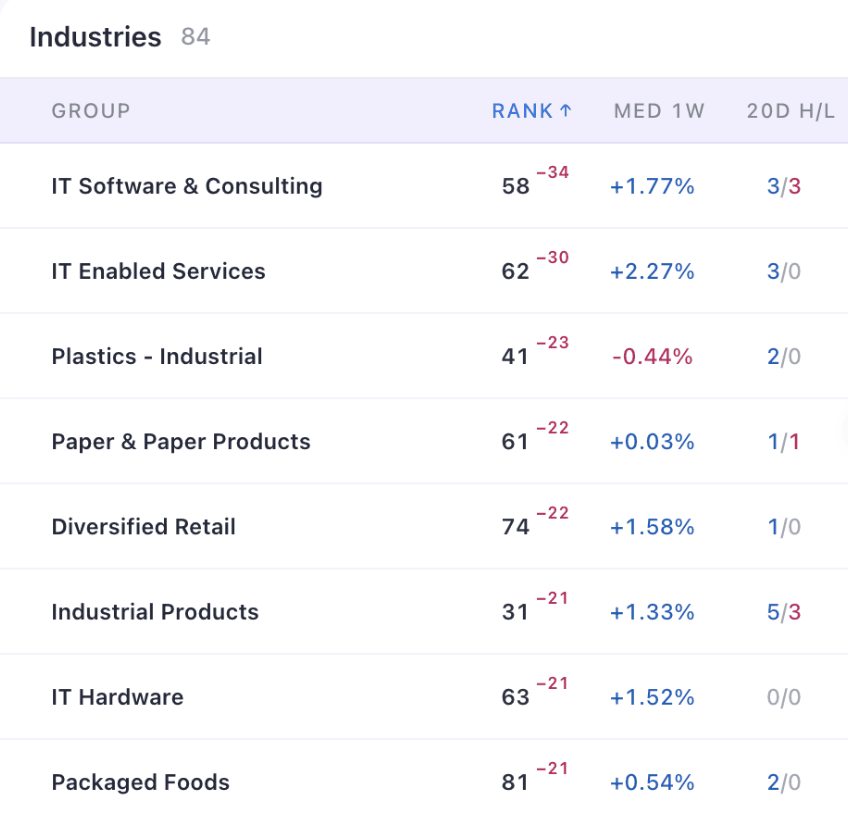
When several industries from the same area fall together, buyers are leaving that whole area. Click the Rank header a fourth time to go back to the normal order.
Step 4: Go from a group to its stocks
Once you know where money is going, drill down. Click a sector to see its industries, then click an industry to see its stocks.
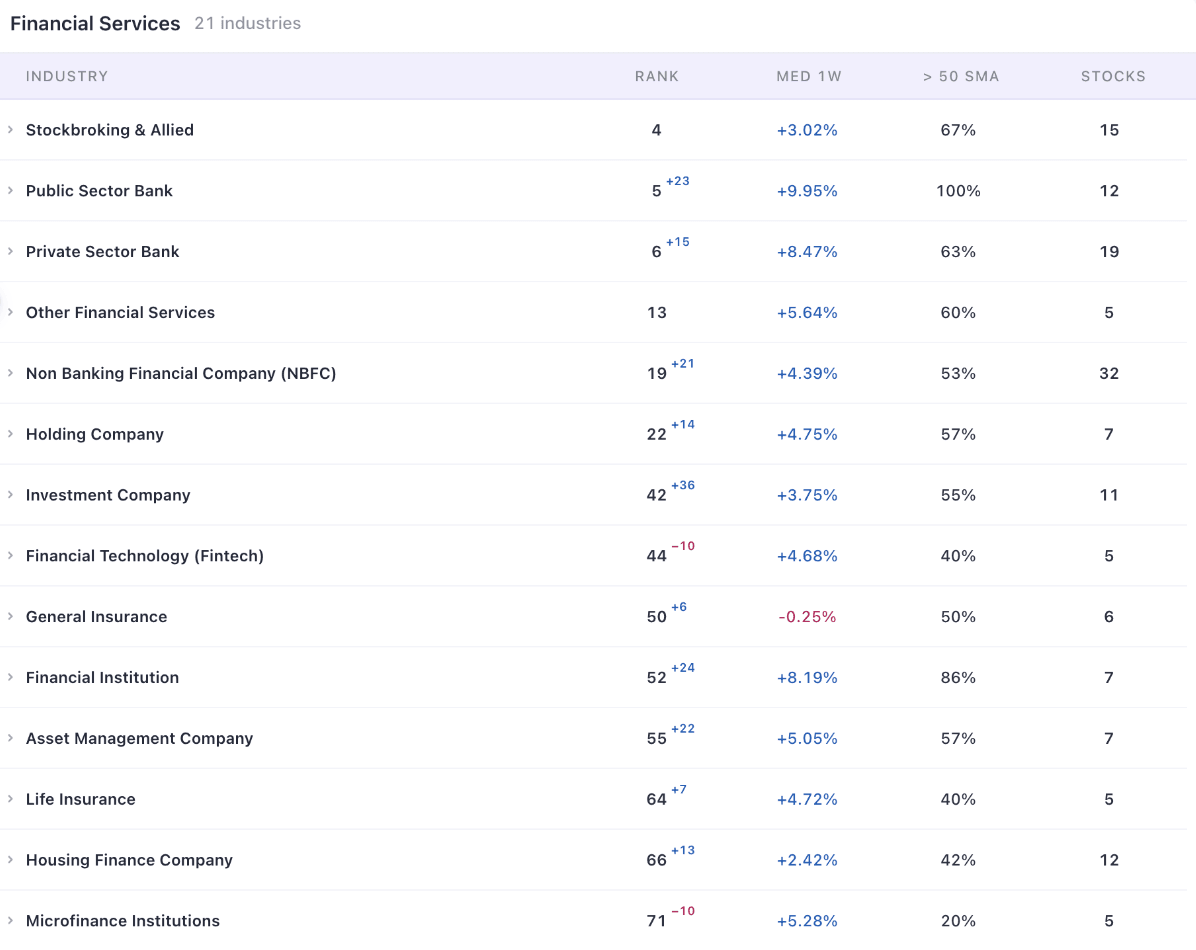
In this example, the strength inside Financial Services was not even. Public Sector Banks (up 23), Financial Institutions (up 24), Asset Management Companies (up 22) and NBFCs (up 21) were all climbing, while Fintech and Microfinance each fell 10 places. The > 50 SMA column shows the share of an industry's stocks trading above their 50-day moving average. For Public Sector Banks it was 100%.
Clicking an industry lists its stocks. Here is Cars & UVs, the biggest climber in this example:
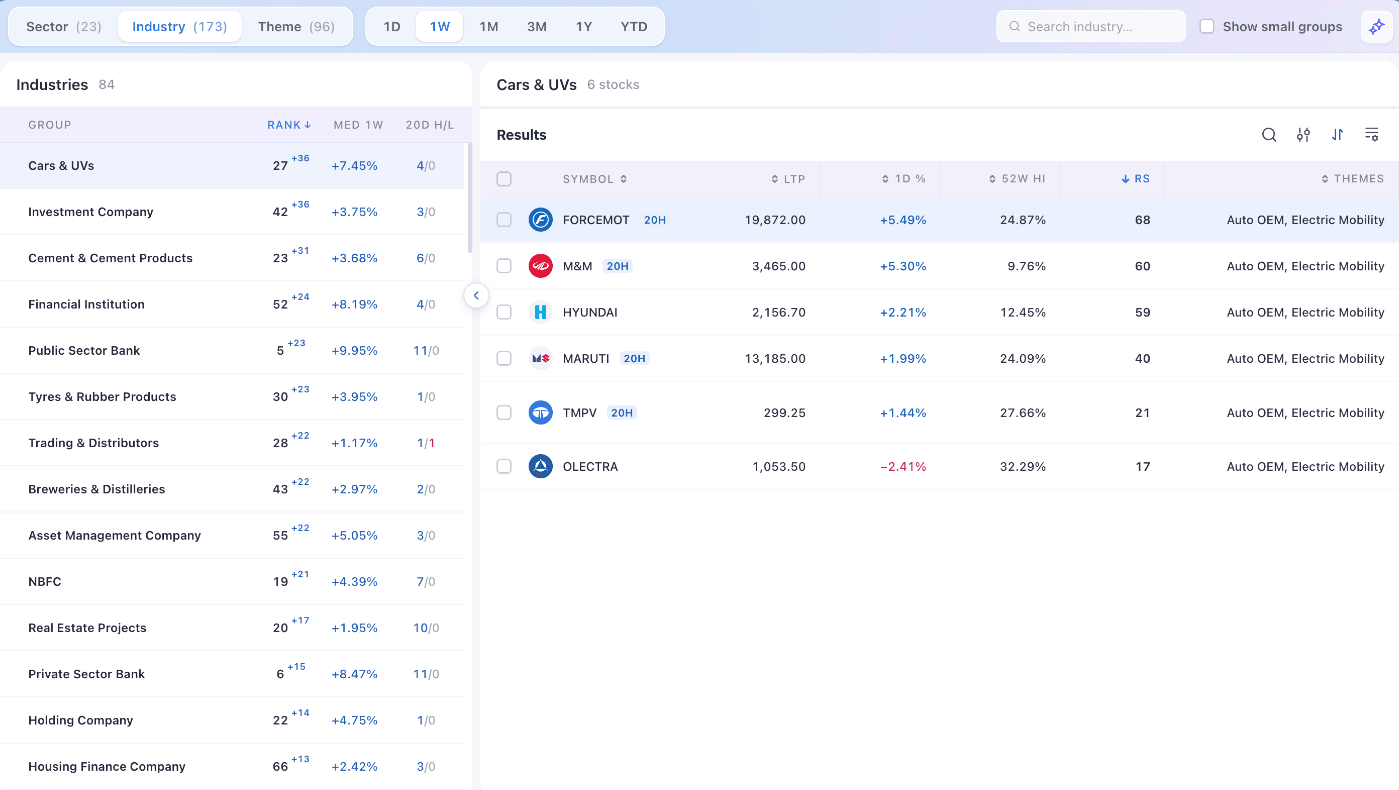
In the stock list, look for two things:
- The 20H tag. The stock is at a 20-day high, so it is taking part in the group's move.
- A high RS rating. The stock has been stronger than most other stocks. The list is sorted by RS, so the strongest names are at the top.
Use Copy or CSV at the bottom of the page to take the list into your watchlist, then study each chart on its own.
Themes: rotation across sectors
Themes group stocks by the story they trade on, across sectors and industries. Auto OEM, for example, holds two-wheeler, car and truck makers that sit in different industries. Themes often catch rotation that sector labels hide.
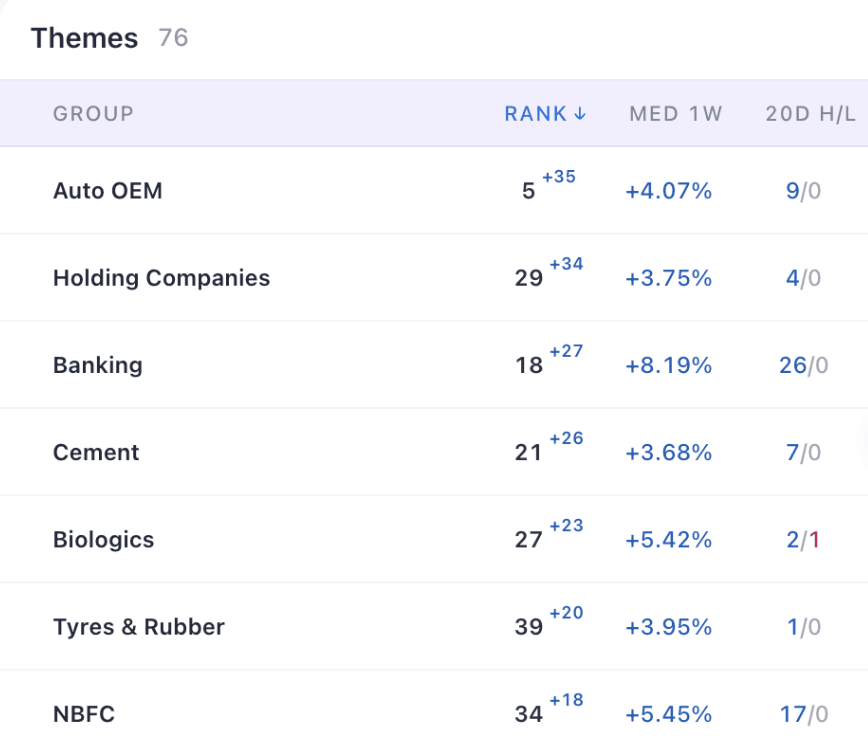
In this example, the theme view confirmed the same rotation. Autos, banks and cement led the climbers. At the other end, Plastics and IT Services fell 24 places each, followed by Engineering R&D (down 23) and AI & Cloud (down 21).
A one-minute rotation routine
You can run this check after every session close in about a minute.
See who is leading. Open Sector in the normal order and note the top five.
See where money is going. Click Rank twice for the biggest climbers. Note the jumps that land near the top.
See where money is leaving. Click Rank once more for the biggest fallers. Watch for leaders that are slipping.
Repeat on Industry and Theme. Rotation usually shows up here first.
Go to the stocks. Open each shortlisted group and study the stocks with a 20H tag and a high RS rating.
Before you act on anything from the list, ask yourself one question:
Is this group improving or leading, and does the stock meet my rules?
Common mistakes
- Treating one week as a trend. A big jump from a low rank is a start. In our example, Investment Company climbed 36 places and was still ranked 42nd. Watch it for a few weeks before you call it a leader.
- Reading a rank drop as a price drop. In our example, IT's median stock rose, and IT still lost 8 places. Rank compares groups with each other.
- Ignoring breadth. A climb with many 20-day highs and few lows is broad. Financial Services showed 61 highs and no lows. A group with as many lows as highs has weaker support.
- Buying the list. The Groups page shows where the strength is. It does not tell you what to buy. Every stock still needs its own chart review, an entry plan and a clear level for managing risk.
See sector rotation in one screen
Sectors, industries and themes ranked after every session close, with every stock and chart one click away.
Open the Groups page →Frequently asked questions
What is sector rotation in the stock market?
Sector rotation is the movement of money from one group of stocks to another as market leadership changes. Groups move through four stages: improving, leading, weakening and lagging. Swing traders try to focus on groups that are improving or leading.
What is the difference between Sector, Industry and Theme?
Sectors are 23 broad groups such as IT or Healthcare. Industries split them into 173 narrower groups such as Public Sector Bank or Cars & UVs. Themes are 96 groups built around the story stocks trade on, such as Auto OEM or Defence, and they cut across sectors. Start with sectors, then use industries and themes to find exactly where the strength is.
What does the small number next to the rank mean?
It shows how many places the group moved in rank over the past week. Blue means up and pink means down. In the normal view it appears only for moves of more than 5 places. When you sort by biggest climbers or fallers, every move is shown.
Why can a group fall in rank when its stocks went up?
Rank compares groups with each other. If other groups rise faster, a group can slip down the list even while its own stocks gain. In our example, the IT sector's median stock rose 1.81%, and IT still fell 8 places.
Which timeframe should I use?
The timeframe changes only the median return column. Rank and the weekly move stay the same. Use 1W or 1M to see what changed recently, and 3M or YTD to judge longer leadership.
Does a top-ranked or fast-climbing group mean I should buy its stocks?
No. The Groups page shows where the strength is. Use it to build a shortlist, then judge each stock on its own chart with a clear plan for entry and risk.
For education only. Scan the Charts is not registered with SEBI as an investment adviser or research analyst. Groups and stocks mentioned in this article show how the tool works and are not recommendations to buy or sell. Rankings change after every session.